Food, Energy and Water Systems
Planning electricity and water together, for homes and farms, so that local solar, rainwater and desalination pay off.
- Completed
- 2021–2022
- Water–energy nexus
- Agriculture
- Distributed energy
- Climate risk
- Optimization
In plain English
What we grow, the energy it takes and the water it uses are one system. Pumping and treating water takes electricity, and farms need both to produce food. Households and farms now have their own options, such as rooftop solar, rainwater tanks, graywater recycling and small desalination units. But these are costly and long-lived, and they depend on sun, rain and a climate that nobody can predict. This line of work asks when such investments pay off, and how to plan them.
Dr. Jones developed it with Benjamin D. Leibowicz at the University of Texas at Austin, in two papers built on optimization models. The first, in Sustainable Cities and Society (2021), sized electricity and water technologies for a neighborhood of Austin homes and found that planning both together, and investing as a community, lowered costs. The second, in Environment Systems and Decisions (2022), moved to a farm deciding how much solar power and desalination to build before knowing whether the coming decades would be wet or dry. Both models are public, so others can rerun and adapt them.
Main points
- Treats electricity and water as one planning problem instead of two separate utilities.
- Moves from a neighborhood of homes to a single farm, showing the same modeling approach works at different scales.
- Adds uncertainty: the farm model commits to investments before the climate is known, then tests them against thousands of simulated weather years.
- Both code repositories are public with archived releases; the farm model reproduces its paper's tables, and the community model ships its scenario results with a synthetic input set in place of licensed household data.
Interactive demoFood, energy and water under climate risk →
Papers
Sharing home solar and water systems makes them pay off
Jones, E.C., Jr., & Leibowicz, B.D. (2021). Co-optimization and community: Maximizing the benefits of distributed electricity and water technologies. Sustainable Cities and Society, 64, 102515. https://doi.org/10.1016/j.scs.2020.102515
Can homes save by making their own power and water? Pooling investments across a neighborhood and planning both together cut costs and emissions.
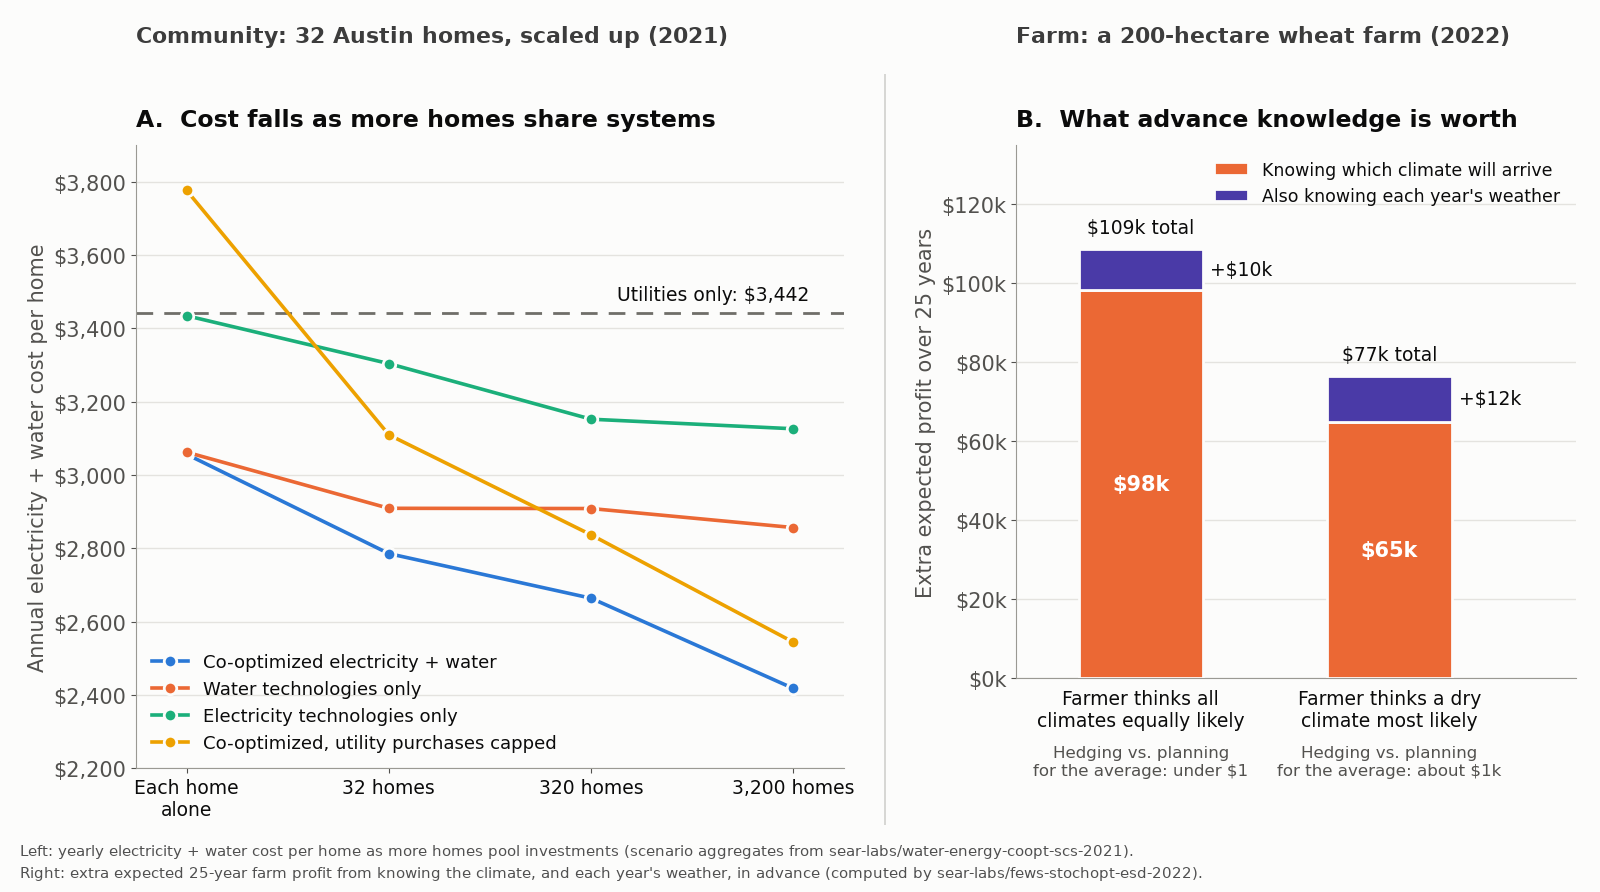
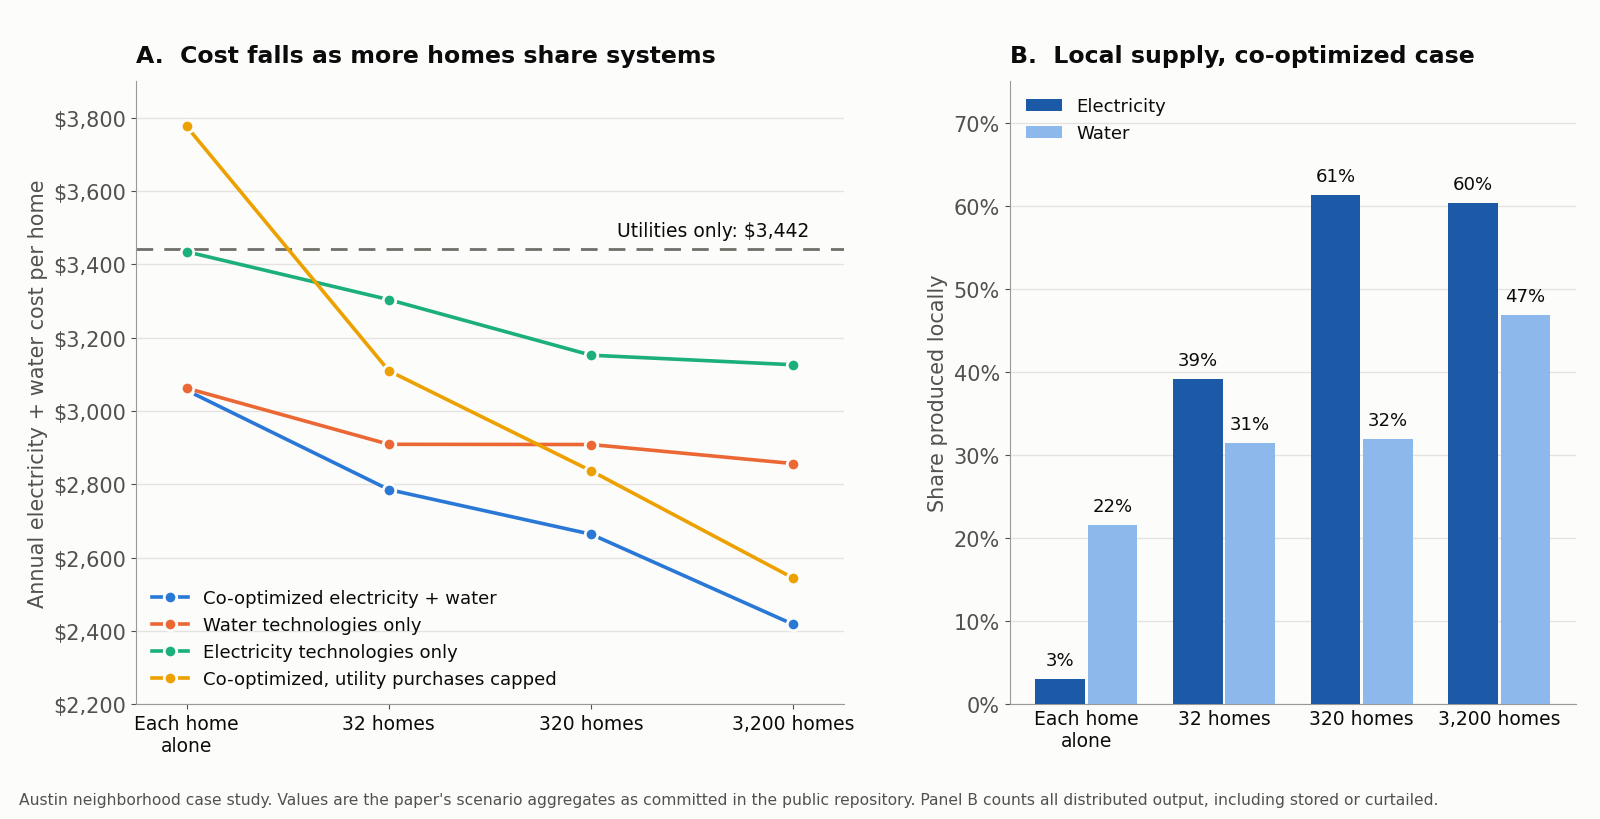
- Co-optimizing electricity and water gave the lowest cost at every community size: about $3,060 a year per home for homes acting alone and about $2,420 for a pooled community of 3,200 homes, against about $3,440 when buying everything from the utilities.
- Water technologies such as rainwater harvesting and graywater recycling saved these homes more money than electricity technologies did on their own.
- The benefit of planning both together grows with scale: only in the 3,200-home community did joint planning save more than the electricity-only and water-only savings added together.
- Distributed water systems running on grid electricity always increased carbon emissions, because small systems use more energy than the city's water plants; co-optimized systems that pair them with local solar and wind always reduced emissions.
Correction note. The paper says planning for electricity alone gives higher local electricity shares than co-optimizing at every community size except homes acting alone; the published scenario tables show this is also not true at 3,200 homes (59.6% vs 60.3%).
For farm water and solar investments, the climate matters most
Jones, E.C., Jr., & Leibowicz, B.D. (2022). Climate risk management in agriculture using alternative electricity and water resources: A stochastic programming framework. Environment Systems and Decisions, 42(1), 117–135. https://doi.org/10.1007/s10669-021-09838-8
How should a farm invest in desalination and solar under an unknown climate? The climate that arrives shapes profit far more than yearly weather.
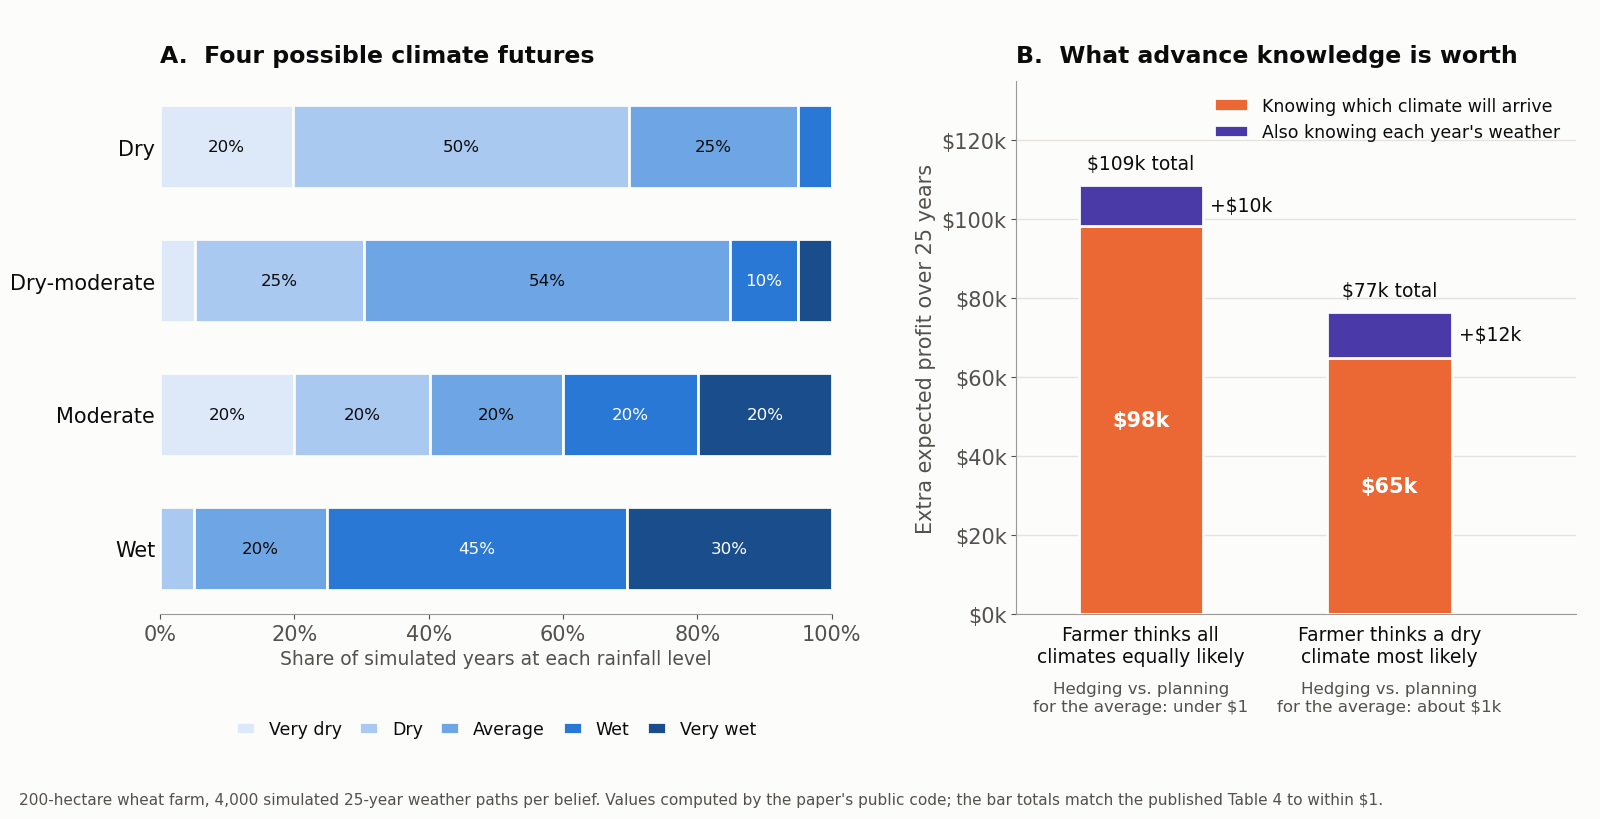
- Expected 25-year profit depended heavily on the farm's beliefs: about $2.25 million when all four climates were treated as equally likely, and about $1.90 million when a dry climate was thought most likely.
- With climates equally likely, knowing in advance which climate would arrive was worth about $98,000 of the $109,000 value of perfect information; also knowing each year's weather added only about $10,000.
- Hedging across all climates gained almost nothing over simply planning for the average climate: $0.49 when climates were equally likely and $941 when a dry climate was most likely.
- Preparing aggressively for an extreme climate can cause significant losses if a more moderate climate arrives instead.
People
- Erick C. Jones Jr., PhD, PEPrincipal Investigator · SEAR Lab directorin
- Benjamin D. LeibowiczAuthor, Sustainable Cities and Society 2021 · Author, Environment Systems and Decisions 2022
Profiles marked in link to LinkedIn. More past and present lab members are on the SEAR Lab team page.