Interactives
The lab's published results, in a form you can move, and a few small teaching models.
From the lab's papers · Teaching models
From the lab's papers
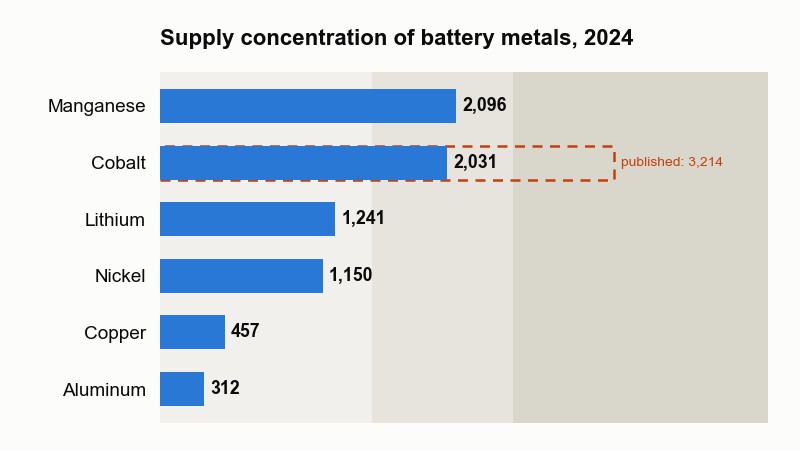
The research itself does not fit on a web page, but its results can. These demos are built from published SEAR Lab papers, a few to each theme. Their numbers come from the papers' own tables, and tests check them against those tables. Where a paper printed a number that later proved wrong, the demo shows the corrected value and says so.
-
Mineral supply chains
Who mines, who refines, and what a cheaper or cleaner plan looks like.
Battery metals come from a handful of countries and companies, and most are refined in fewer still. What would it cost to plan the chain differently?
-
Battery recycling
Where to make black mass, and how to make it cheaply.
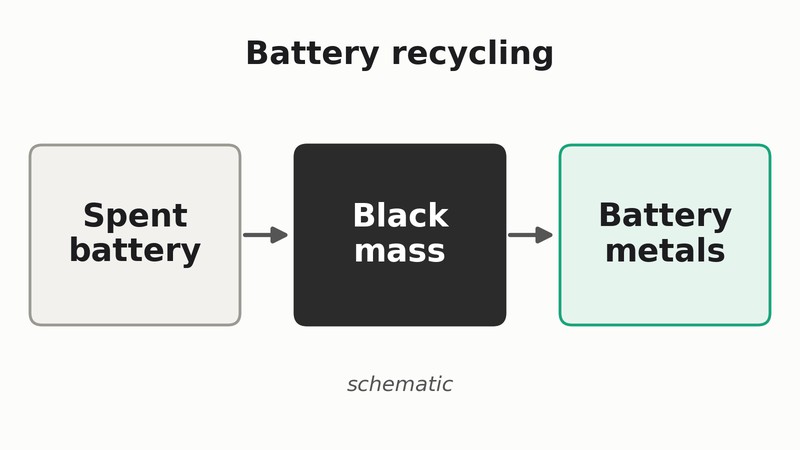
Before any metal comes back out of a spent battery, it has to be ground into a powder called black mass. Where should that happen, and does it need expensive equipment?
-
The Texas grid
Where power is made, where demand is going, and how new loads can power themselves.
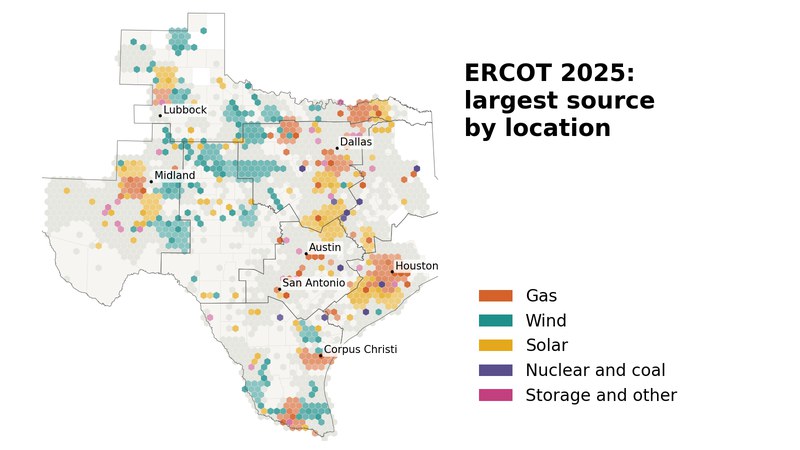
Texas runs its own grid. As wind, solar and very large new loads arrive, who makes the power, and who pays for it?
-
Decarbonizing travel
Shared self-driving fleets and extended-range EVs.
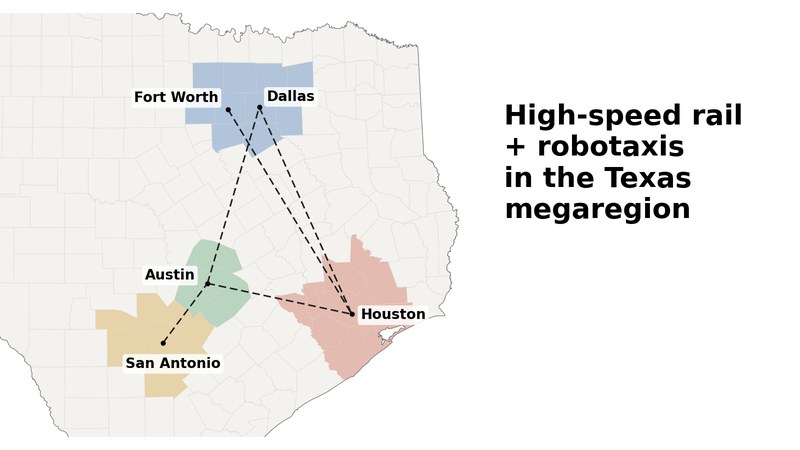
Two ways to take carbon out of car travel: share the cars, or put a bigger battery in them. What does each one buy?
-
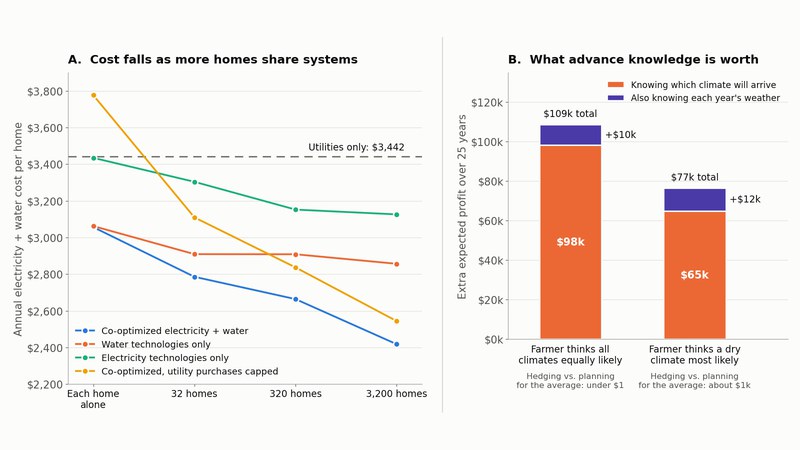
Food, energy and water under climate risk
Sharing and co-planning power and water; farming under an unknown climate.
Making your own power and water pays when you share it and plan both together. Planning for a climate you cannot know costs more than bad weather.
-
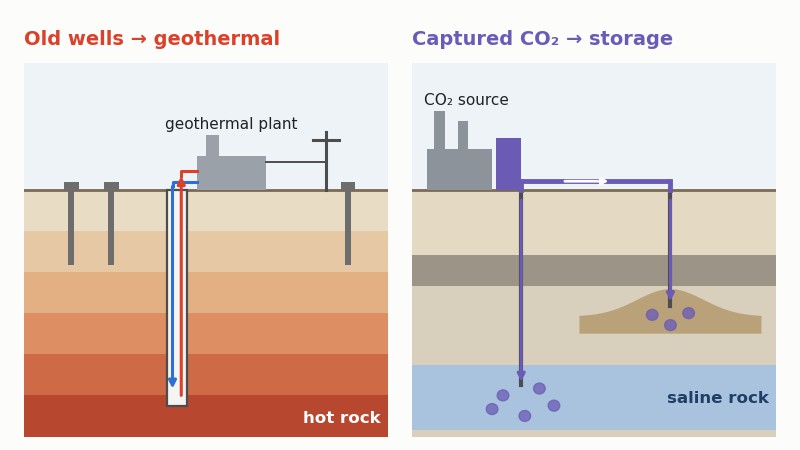
A second life for fossil-fuel infrastructure
Old wells to geothermal, phased CO₂ pipelines, geothermal for data centers.
Old oil wells, depleted reservoirs and the skills that built them could carry clean, firm power. Where, how fast, and at what cost?
-
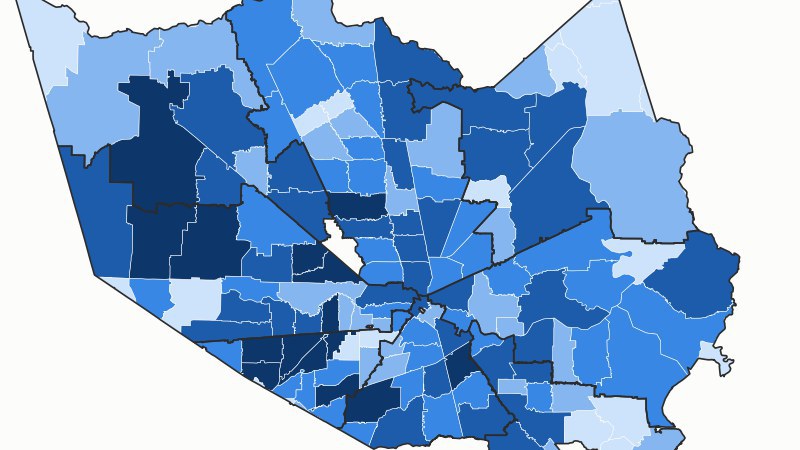
Access and health
Getting COVID-19 vaccines to the neighborhoods that need them.
When there are not enough doses to go around, who gets served first, and what does the shortage cost?
All seven on one page · Every SEAR project, with its papers and people
Teaching models
These are teaching toys, not research. They run on fixed coefficients, nothing in them is optimized, and no number they produce should be cited. What they are good for is the shape of an argument — the thing that is hard to see in a table and obvious once you can move it.
-
What a Grid Is Made Of
Energy demand → the generation that meets it → components → metal → rock.
Copper is a few percent of the metal and the large majority of the rock. Steel dominates the tonnage — a wind tower is a very heavy object — while copper, which nobody weighs, dominates the mining.
Pick a generation mix and it tells you what that mix is made of. Two timescales: over a year, the fleet run flat out against annual demand; over one day, the share of demand the battery carries.
-
Why Supply Can't Catch Up
Recycling and new mines, the two ways to add supply, and why neither is quick.
The recovery loop's size was set by packs built ten to fifteen years earlier, so it cannot ramp when a shortfall opens. A new mine takes about sixteen years, so for any target inside that window the decision is already behind us.
Two panels: push demand growth until a gap opens and try to close it with recycling; then drag a target year toward the present and watch the required start date slide past today.
-
Accurate, and Still Wrong
A planning model → a cheap surrogate of it → a supply-chain model that plans on the surrogate.
A surrogate can fit a model's output well and still send the next model to the wrong decision, because small errors near a step flip which plants get opened. What matters is the decision, not the fit.
Add runs and watch the fit improve faster than the decisions do. Where What a Grid Is Made Of lets you choose the mix, here a model chooses it.
Where the numbers come from
Every coefficient in these models says which kind it is — a published figure from the IEA, EIA or USGS, or an order-of-magnitude estimate made for the page. Roughly a third are estimates. That is fine for arguments that turn on ratios of two hundred to one rather than on ten percent accuracy, but it is not fine to hide, so the label travels with the number and every model carries its figures as a table as well as a picture.
Where a model cannot compute something, it says so and does not draw it. The day-shape diagram on What a Grid Is Made Of is a schematic that deliberately does not respond to the controls, because the model underneath has no time resolution and a diagram that reacted to the sliders would be claiming to have calculated something it has not.
The real versions of these questions — a mix that is chosen rather than given, under capacity limits, lead times and recovery, and models linked so one's answer becomes the next one's input — are the actual research. That work lives in Research and in the projects.