Lean Manufacturing Lego Demo
Students build a Lego train on a classroom assembly line, measure what goes wrong, fix it with lean tools and build again.
- Completed
- 2024–2025
- Lean manufacturing
- Line balancing
- Quality control
- Education
In plain English
Lean manufacturing is a way of running a production line so work flows smoothly, with as little waiting, searching and rework as possible. This classroom module lets students feel those ideas with their hands. Teams build a small Lego train on a line of five stations, each adding one part before passing the train on. Round one is set up badly on purpose, with mixed-up parts bins and rough instructions. Students time every station and plot control charts, which show whether a process is steady or swinging unpredictably.
Then they fix it. Picture instructions make every builder do the job the same way (standard work). Each bin holds only the parts its station needs, labeled and within reach (5S). The line bends into a U so trains travel less, and a Kanban board makes the work in progress visible. Last, students rebalance the line: the slowest station sets the pace for everyone, so short tasks are combined until the stations carry similar loads. With the module's published task times, five stations become three. Round two shows the difference.
Main points
- Materials: enough Lego bricks for the five-station train (the build manual uses 28 standard bricks per train, in black, blue, white, yellow, red and brown), one parts bin and one picture instruction sheet per station, stopwatches, and a whiteboard for the Kanban board; the lab ran it on a roller conveyor, while classroom groups lined up along a table.
- Roles, from the module's checklist: a builder at each station plus a timer, an observer and a quality checker; groups can also watch another group work, which students said helped them spot patterns they missed while building.
- What to measure: time per station for every train, defects per train, trains waiting at each station and trains finished per round; the module's spreadsheet template turns station times into means, ranges, control limits and standard deviations.
- How a session runs: a pilot walkthrough, a timed first round on the unimproved line, a debrief using the control charts and a Kaizen (small-improvement) discussion, a second round on the improved line, and a short written reflection; the documents do not fix a session length.
- Still missing: a facilitator guide, since the worksheets assume someone who already knows how the activity runs.
Lean ideas at the workstation
Cycle time and the bottleneck
Cycle time is how long a station takes to do its share of one unit. The slowest station is the bottleneck: the whole line can go no faster than it.
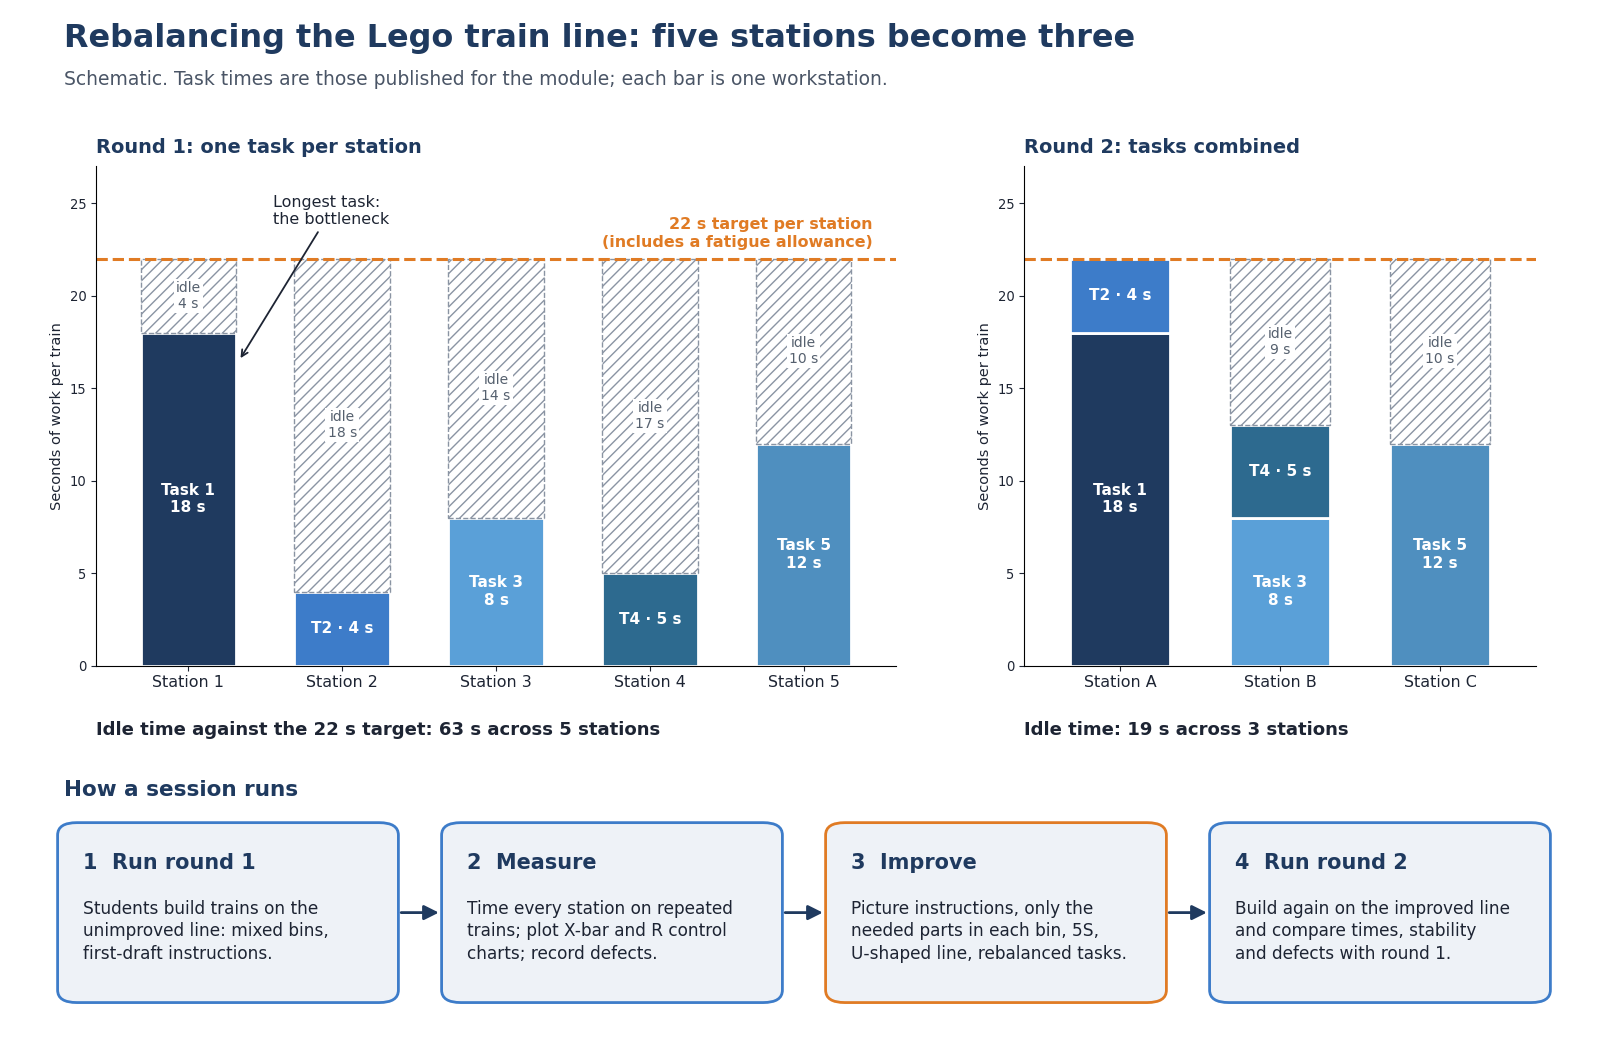
At the workstations: Timers record every station on every train. In the published task times one station takes 18 seconds and another takes 4, so the faster builders spend most of each cycle waiting.
Line balancing
Assigning tasks to stations so each carries about the same amount of work, without going over a target time per station.
At the workstations: With a 22-second target (which includes an allowance for fatigue), tasks are ranked by positional weight, a task's own time plus the time of all the work that must follow it, and packed into stations in that order: 18 + 4, 8 + 5, and 12 seconds. Five stations become three, with 19 seconds of idle time left over.
Control charts (statistical process control)
A control chart plots a measurement over time between upper and lower limits calculated from the data. Points outside the limits mean something unusual is disturbing the process.
At the workstations: Students plot the average (X-bar) and the range (R) of station times. On the first line many averages fell outside the limits; on the improved line the points stayed within them.
Standard work and visual instructions
Doing a task the same, best-known way every time, written down so that anyone can follow it.
At the workstations: Each station has a step-by-step picture manual. Unclear first-draft instructions caused defects in round one, so the manual was revised and retested.
5S and parts at the point of use
5S (sort, set in order, shine, standardize, sustain) keeps a workplace organized so that nobody hunts for anything. Parts are stored where they are used.
At the workstations: Each station's bin holds only the bricks it needs, labeled by station and part type, which also makes switching a station over quicker.
Continuous flow, just-in-time and Kanban
Just-in-time means making and moving only what the next step needs, when it needs it. A Kanban board shows each job as a card moving from Backlog to To Do, In Progress and Done, which keeps work in progress visible and under control.
At the workstations: The stations sit around a U-shaped line so trains and people move less, and a whiteboard Kanban board tracks the work.
Kaizen and finding root causes
Kaizen means small, continual improvements made by the people who do the work. A Pareto chart ranks problems by how often they occur, the 5 Whys keeps asking why until it reaches a root cause, and a failure-mode analysis (FMEA) scores each possible failure by how serious, likely and hard to detect it is.
At the workstations: Between rounds, groups map how materials and information flow (a value stream map), rank the defects they saw, trace their causes and propose changes, which round two then tests.
Papers
Teaching industrial engineering on a Lego train line
Ravichandran, K.R., Ramalingam, N., Mohanraj, M.R., & Parameswaran, N. (2025). Hands-on approach towards Industrial engineering concepts through interactive Lego workstation assembly. Proceedings of the IISE Annual Conference & Expo 2025, 1768–1773. https://doi.org/10.21872/annual2025_8849
Students build a Lego train on an unimproved five-station line, measure it, improve it with lean and quality tools, and compare.
- On the unimproved line, unclear instructions, uneven stations and disorganized parts bins caused bottlenecks and high defect rates, and control charts of station times showed the process was out of control.
- Picture-based instructions, bins holding only each station's parts, a U-shaped conveyor and rebalanced stations brought the improved line within its control limits and reduced defects.
- Ranking tasks by positional weight under a 22-second limit per station combined five stations into three, leaving 19 seconds of idle time.
- The authors conclude that moving from the unimproved to the improved line gives students hands-on practice with lean, Six Sigma and quality tools, including Kanban, 5S, value stream mapping, Pareto analysis, FMEA and the 5 Whys.
Code and materials
People
- Erick C. Jones Jr., PhD, PEPrincipal Investigator · SEAR Lab directorin
- Karthik Raj RavichandranAuthor, Proceedings of the IISE Annual Conference & Expo 2025 2025
- Niranjan RamalingamAuthor, Proceedings of the IISE Annual Conference & Expo 2025 2025
- Maheshwar Raju MohanrajAuthor, Proceedings of the IISE Annual Conference & Expo 2025 2025
- Nithish ParameswaranAuthor, Proceedings of the IISE Annual Conference & Expo 2025 2025
Profiles marked in link to LinkedIn. More past and present lab members are on the SEAR Lab team page.