Tarrant County Land Value: What Each Acre Pays
How much property tax each acre of Tarrant County produces, and why some areas raise less: tax rates, how much is built, or what the buildings are worth.
- Active
- 2024–present
- Property tax
- Land value
- GIS
- Hexagon maps
- Python
In plain English
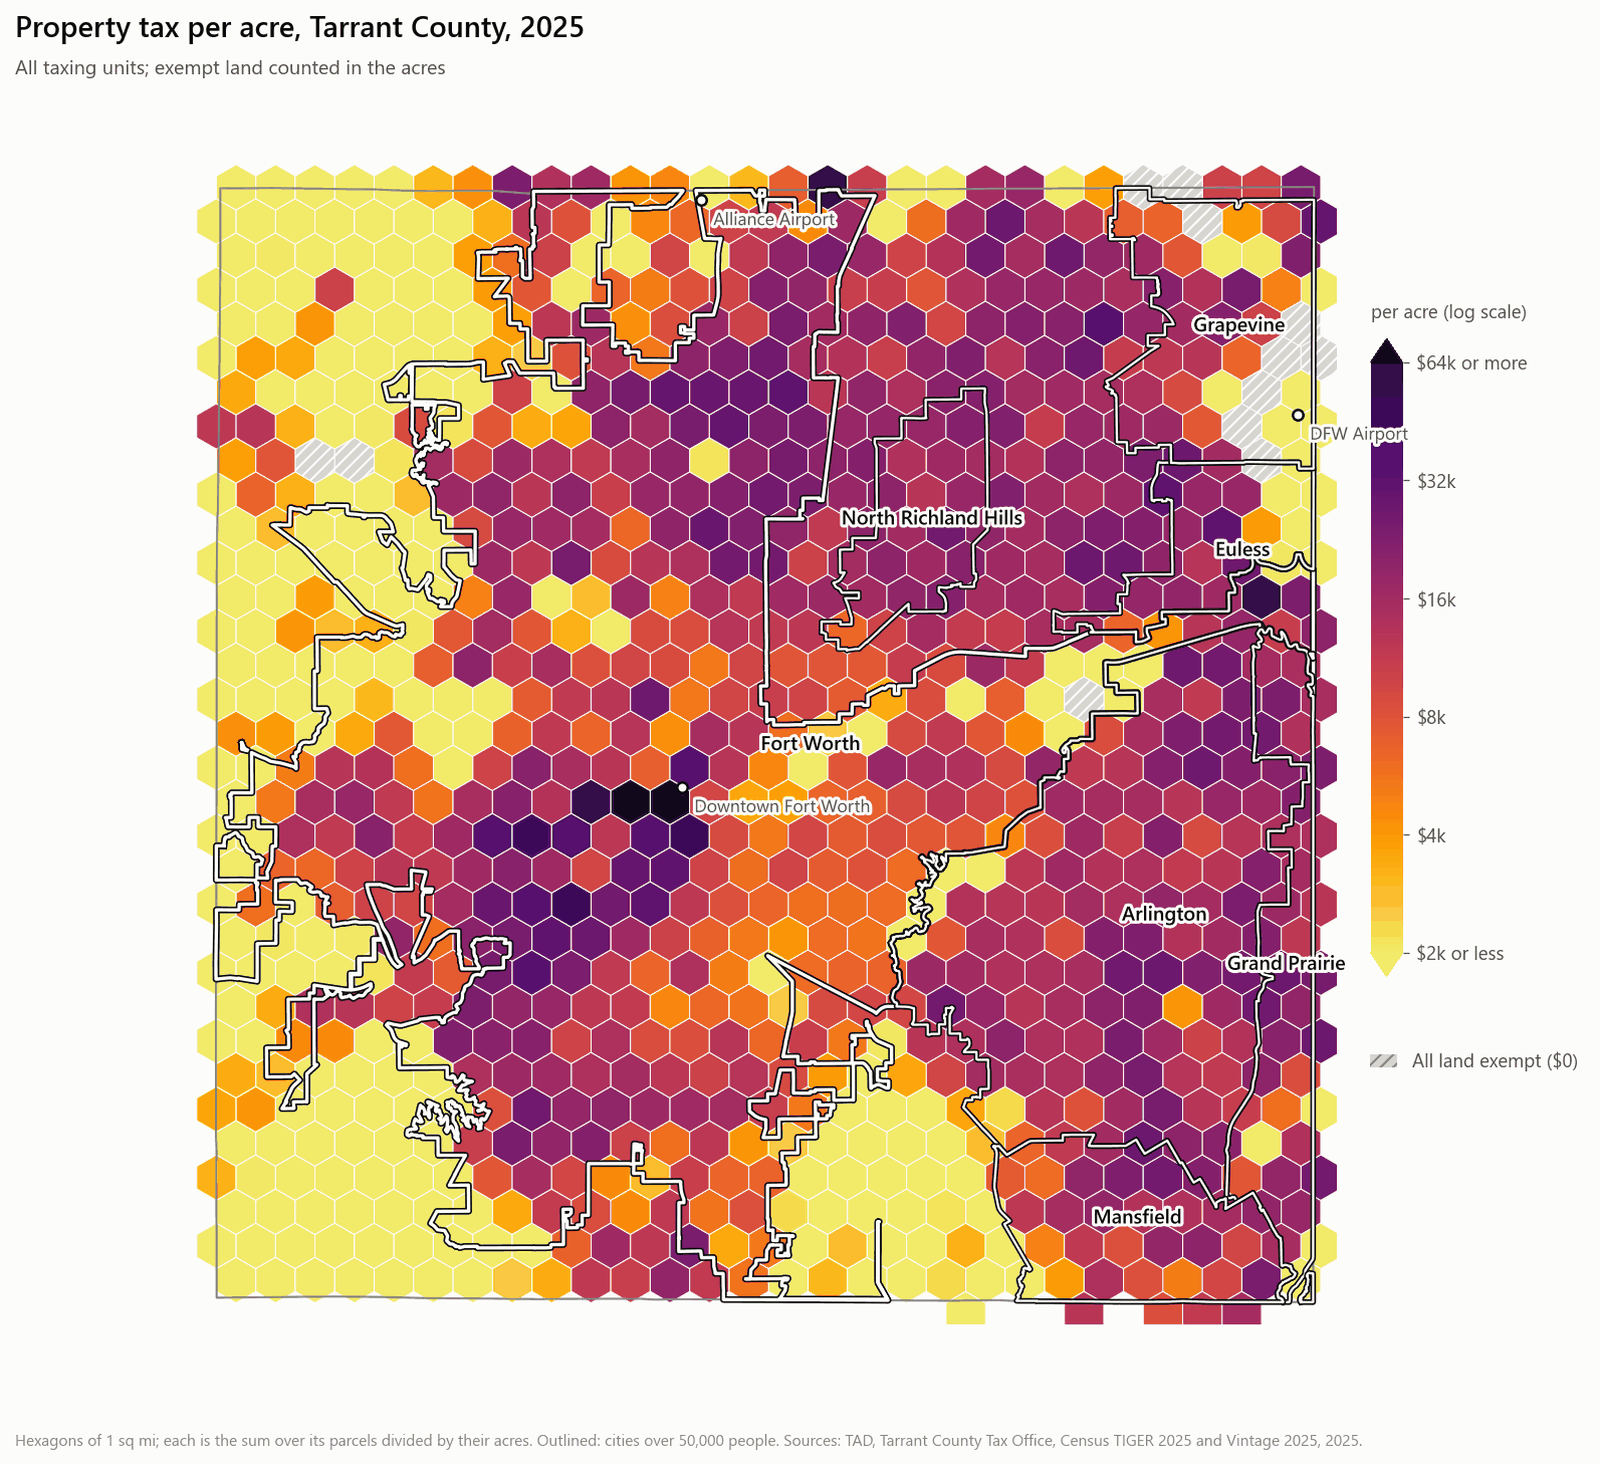
Fort Worth and its neighbours pay for roads, water and sewer lines out of property tax, so where that tax comes from matters. This project asks how much each acre of Tarrant County produces, and why some areas raise less than others: lower tax rates, less building on the land, or lower-value building. In 2026 the lab rebuilt the analysis from scratch as a reproducible Python pipeline that joins the 2025 appraisal roll to 660,267 taxable parcels, computes tax from each taxing unit's adopted rates, checks it against the tax actually billed, and reports only area totals.
Property tax from all taxing units came to about $2,307 per resident county-wide and $2,150 in Fort Worth, but $1,070 in Fort Worth's council District 11. East Fort Worth (Districts 5, 8 and 11) raises 0.69 times the city's average tax per acre, mostly because its land carries less building and lower-value building, not lower rates. District 11's low effective tax rate comes mostly from appraisal caps: 42% of its single-family homes are capped, against 16% in the rest of the city. Some figures are estimates: a few taxing units collect their own taxes, Northwest ISD is approximated from its posted rate, some special districts are missing, and council-district populations are 2020 Census counts scaled to 2025.
Main points
- About 384,000 taxable acres produce an average of $13,508 in property tax per acre.
- Single-family homes pay 61% of the county's property tax on 31% of its land.
- The rebuild fixed two earlier errors: appraised value had been reported as tax, and records were matched on owners' mailing addresses rather than parcels.
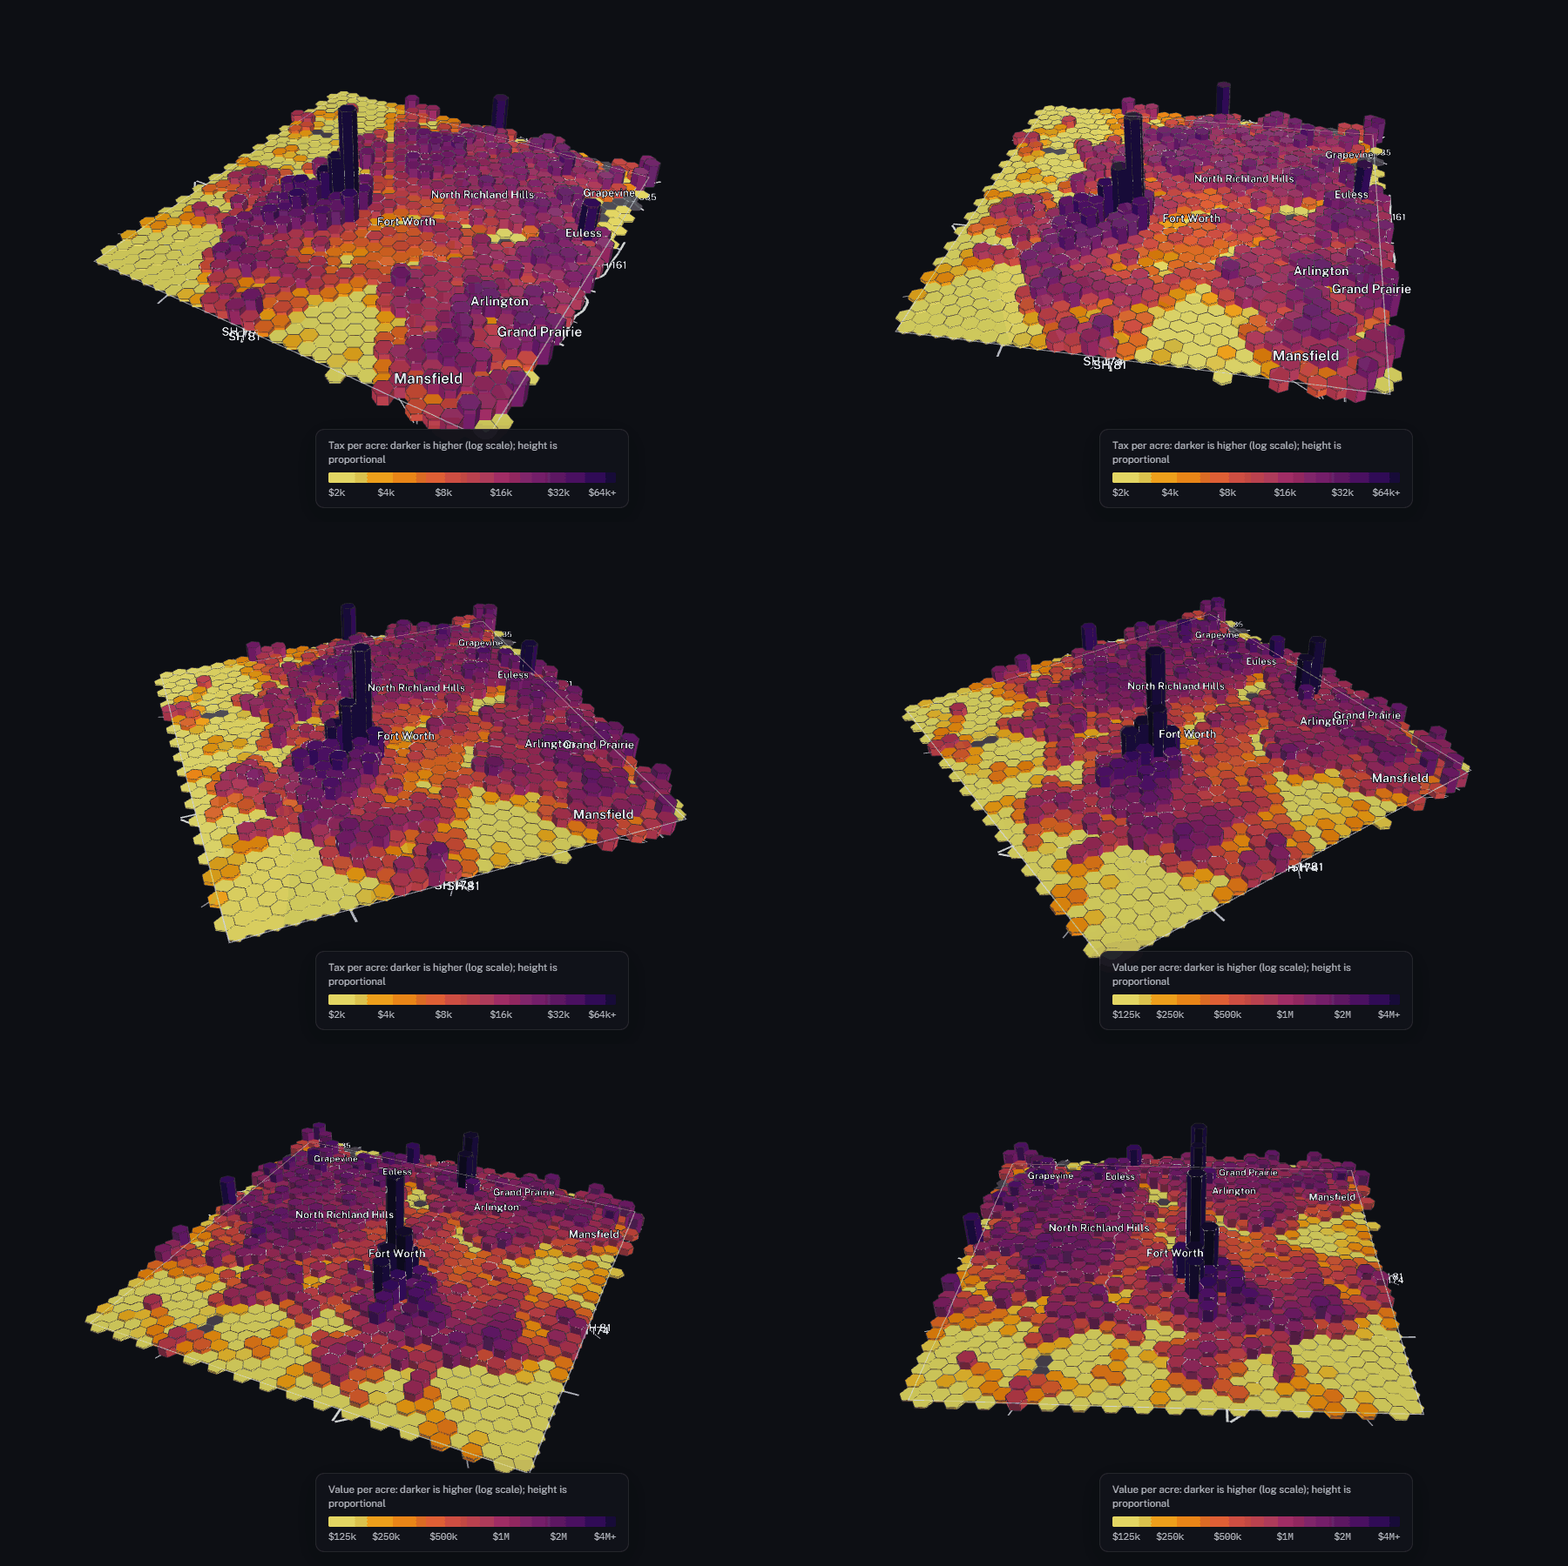
- Equal-area hexagons compare places of different shapes fairly, and the lab's open-source hexmap-web library draws them as interactive maps.
- Next is the cost side: whether the tax each area raises covers the roads, water and sewer lines that serve it.
Papers, code and materials
- Codesear-labs/hexmap-web: the lab's open-source library for interactive hexagon maps, built for this project
- RelatedMapping Communities: the lab's earlier ArcGIS work on services, health and place
- RelatedBuilding Asset Mapping: rooftop solar across DFW, built on the same appraisal data
- RelatedTexas Grid Dashboard: ERCOT generation mapped with the same hexmap-web library
People
- Erick C. Jones Jr., PhD, PEPrincipal Investigator · SEAR Lab directorin
- Ritesh MuralidharStudent researcher (2024): earlier work on the question
- Ravi PrakashaStudent researcher (2024): earlier work on the question
- Darshan Ujjini MallikarjunaStudent researcher (2024): earlier work on the question
- Lokesh Ram HariramStudent researcher (2024): earlier work on the questionin
- Varun KulkarniStudent researcher (2025): earlier work on the questionin
- Pratik GhimireStudent researcher (2025): earlier work on the question
Also contributed: Harshitha Krishna Rao (2024) and Devadharshini Udayakumar (2025). Profiles marked in link to LinkedIn. More past and present lab members are on the SEAR Lab team page.