Waste Analysis: Where the World's Trash Goes, and Where Nobody Knows
Tracing municipal solid waste from region to material to fate with World Bank data, and testing whether the gaps in countries' waste records follow their level of development.
- Active
- 2026–present
- Waste
- Material flows
- Sankey diagrams
- Data
In plain English
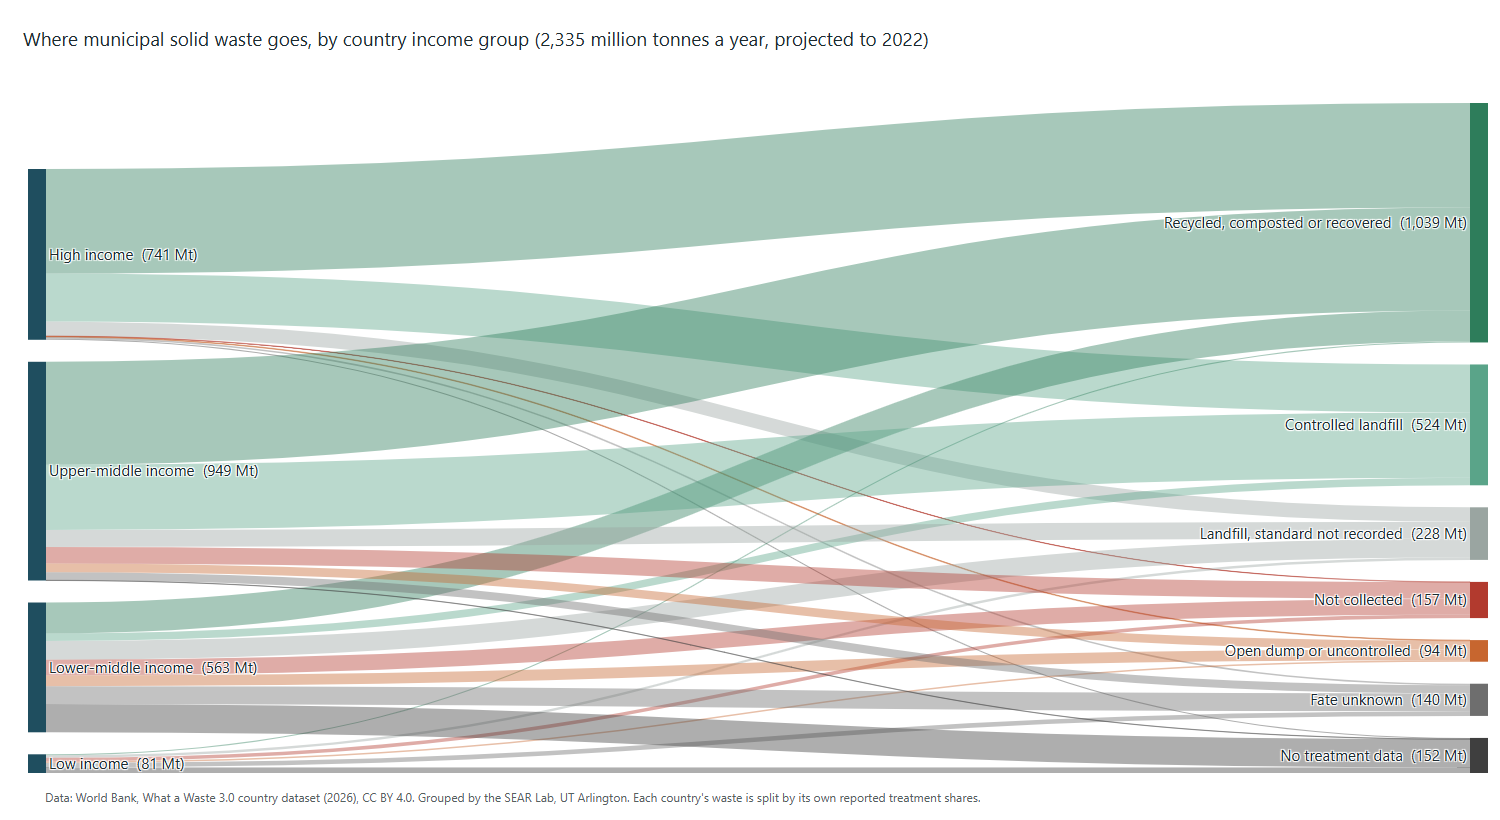
Every country produces trash, but not every country records what happens to it. Using the World Bank's What a Waste country data for 217 countries, students built a pipeline that converts each country's waste composition and treatment shares into tonnages and draws them as flows from region to material to fate: recycled, composted, burned, landfilled or dumped. The world generates more than two billion tonnes of municipal solid waste a year, and food is the largest single material.
In 2026 the lab rebuilt the analysis as reproducible code that runs on both the 2018 edition of the data and the new 2026 one, and turned to a sharper question: where is a country's waste unaccounted for, and why? The early answer, tested against hypotheses fixed in advance, is that gaps in waste records track a country's level of development more than its general statistical capacity. The gaps are shrinking mostly because waste once recorded as "unknown" is now recorded as uncollected, or as landfilled to an unrecorded standard, rather than because more of it is well managed. That analysis is being written up and has not been published.
Main points
- Converts World Bank country data into regional flows of material and treatment.
- Reproducible: the students' original pipeline re-runs exactly, and the maintained version handles both editions of the data.
- Tests, with hypotheses fixed in advance, whether gaps in waste records follow development or statistical capacity.
- Next: figures, and a paper on the 2026 data.
Papers, code and materials
People
- Erick C. Jones Jr., PhD, PEPrincipal Investigator · SEAR Lab directorin
- Pradeepa ChakkaravarthyStudent researcher (2026): pipeline and draft
- Hritik PatilStudent researcher (2026): pipeline and draftin
Also contributed: Kankshita Siddhabathuni and Lokesh Ram Hariram (2026). Profiles marked in link to LinkedIn. More past and present lab members are on the SEAR Lab team page.